❇️ HOW CAN I ANALYZE ATTENDANCE AND SEE WHICH CLIENTS AND ACTIVITIES ARE MOST ACTIVE?
With Attendance Analysis, you can turn the booking report downloaded from BookyWay into a clear, easy-to-read overview.
In just a few seconds, you can see, for example:
- which clients attend your center most often;
- which clients made only a few bookings during the period analyzed;
- which activities have the highest attendance;
- which activities have lower participation;
- how many bookings and absences were recorded during the selected period;
- how many credits were used;
- how many different clients took part in each activity.
You can use this information to better understand how your center is performing, identify clients you may want to contact again, and see which activities are performing best.
How to use Attendance Analysis
1️⃣ Download the report from BookyWay
From the Admin Portal, go to the Reports section
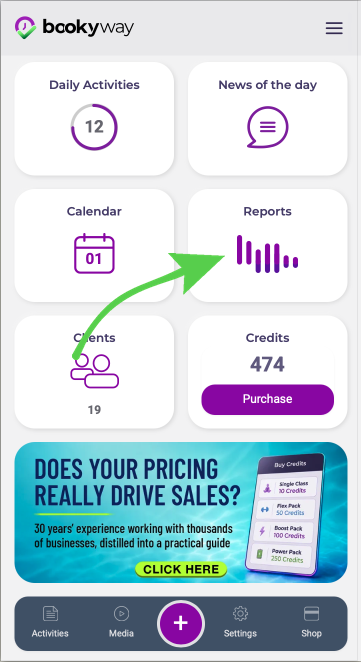
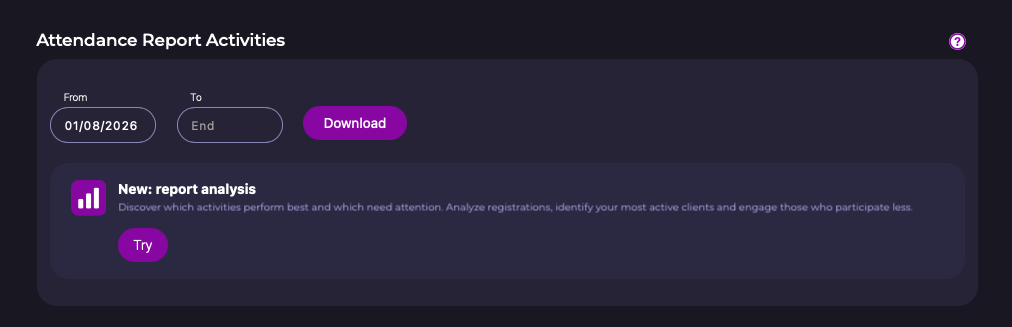
In the Course and Lesson/Activity Attendance Report section:
- choose the period you want to analyze by entering the From and To dates;
- click Download
BookyWay will generate the report for the selected period.
👉 We recommend choosing a meaningful period for your analysis, such as the last month, the last three months, or a specific period you want to examine more closely.
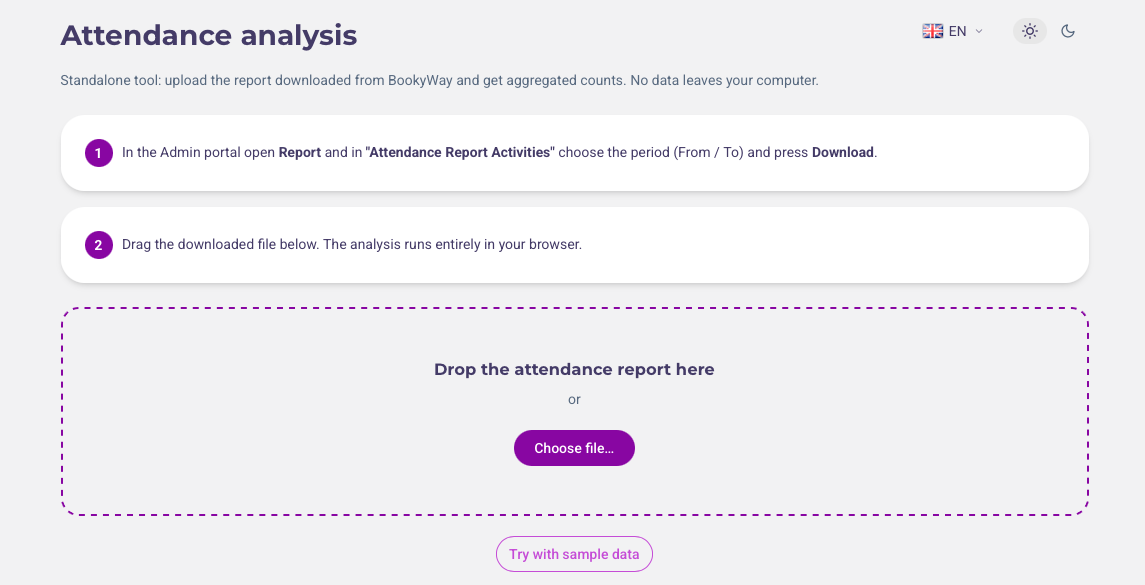
2️⃣ Open the Attendance Analysis tool
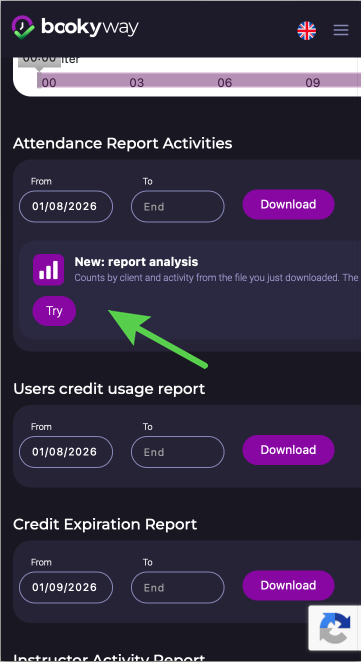
Still in the Reports section, you will find the box dedicated to the new Report Analysis feature.
Click Try it.
The Attendance Analysis tool will open, where you can upload the report you just downloaded.
Clients with more or fewer bookings, activities with higher or lower attendance: see everything in just a few seconds by simply uploading the report downloaded from this page.
3️⃣ Upload the report
You can:
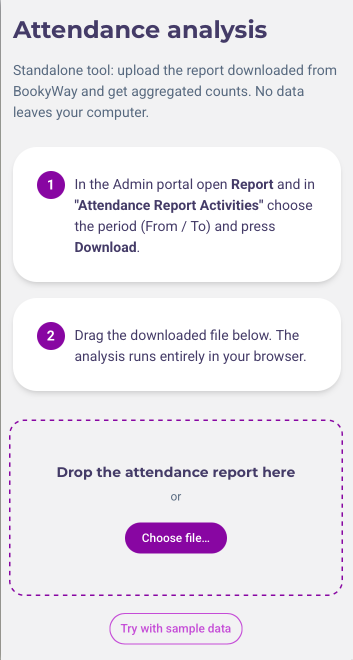
- drag and drop the file into the dedicated area;
- or click Choose file and select it from your computer.
Once uploaded, the report is processed automatically and the results are displayed immediately.
If you want to see how it works before using your own data, click Try with sample data
📊 Analysis by client
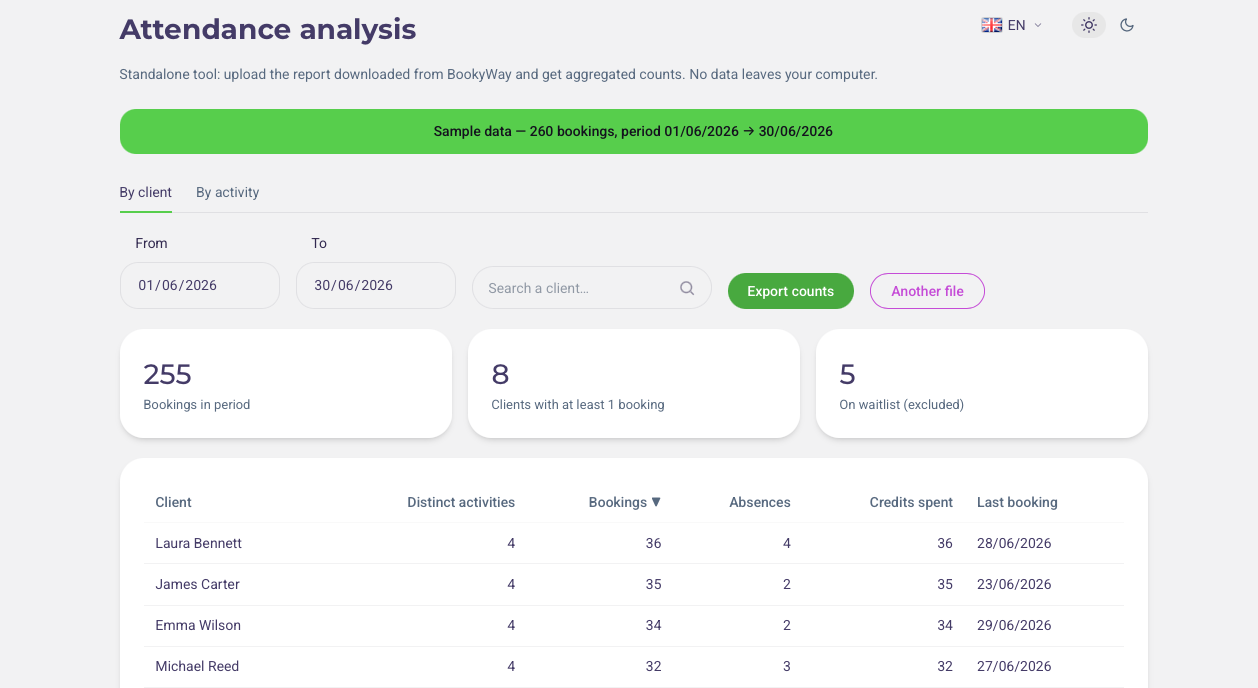
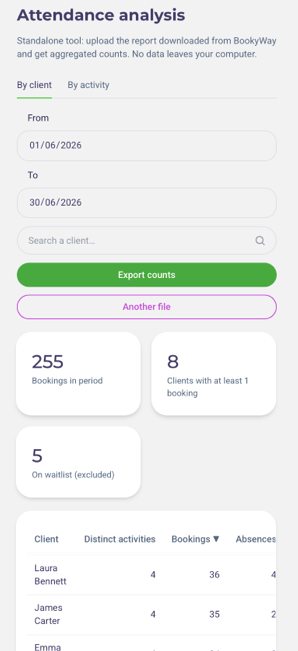
Select By client to view each client’s activity during the selected period.
For each client, you can see:
- Activities attended;
- Bookings;
- Absences;
- Credits used;
- Last booking date
⚠️ Important: the analysis is based only on the bookings included in the report. A client who did not make any bookings during the selected period will not appear in the list. To identify clients who may have stopped attending, download a report covering a longer period and check the Last booking column.
At the top, you will also find summary information such as:
- total number of bookings during the period;
- number of clients with at least one booking;
- any waiting-list bookings, which are excluded from the totals.
You can use the search field to quickly find a specific client.
👉 Why is this useful?
This analysis allows you to quickly identify, for example:
- your most frequent clients;
- clients who are attending less often;
- clients whose last booking was some time ago within the period analyzed;
- patterns worth looking into, such as a high number of absences.
This information can also help you decide when it may be useful to contact a client again or check whether the activities you offer are meeting their needs.pportuno ricontattare un cliente o verificare se le attività proposte stanno rispondendo alle sue esigenze.
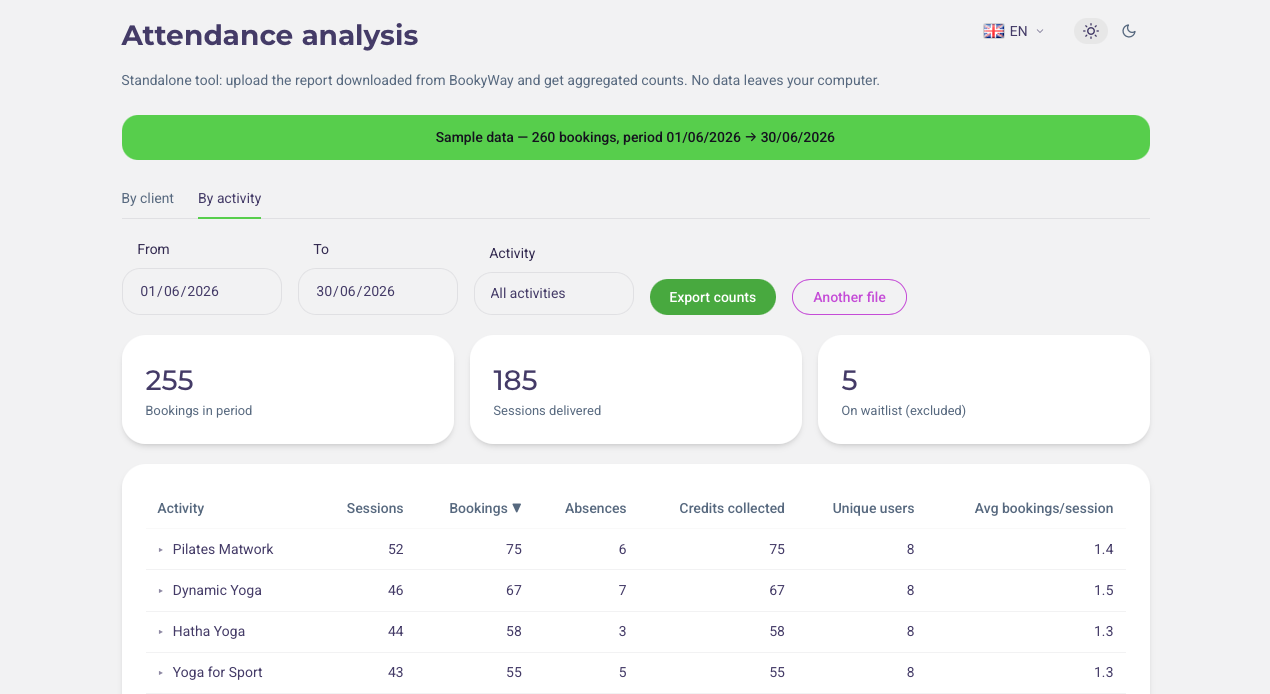
📊 Analysis by activity
For each activity, you can see:
- number of sessions held;
- total number of bookings;
- absences;
- credits collected;
- number of unique clients who attended;
- average bookings per session.
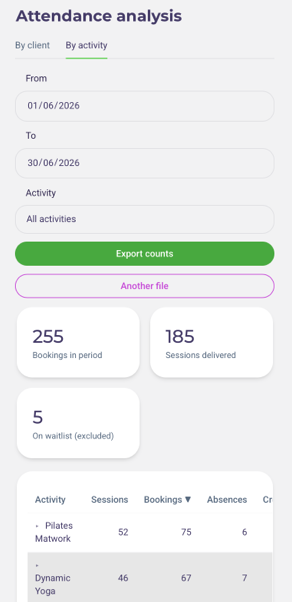
Select By activity to analyze the performance of the activities offered during the selected period.
This gives you an immediate overview of which activities have higher participation and which are attended less frequently.
👉 Why is this useful?
You can use this information to:
- understand which activities are most popular;
- identify activities with lower participation;
- compare the number of sessions held with the bookings received;
- evaluate days, times and types of activities;
- make more informed decisions about future scheduling.
For example, an activity that is offered frequently but has a very low average number of bookings per session may be worth reviewing in terms of time, frequency or how it is scheduled.assa di iscritti per sessione potrebbe meritare una verifica su orario, frequenza o modalità di proposta.
🔽 Details for each individual lesson
Click a row in the table to expand it: the activity will be broken down by day and time, for example “Monday 09:00”, showing sessions, bookings, absences and the average number of bookings for each one.
Click one of these rows again to view each individual date.
This allows you to answer specific questions such as: “For the Monday 9:30 lesson — and only that lesson — what was the average number of attendees over the last three months?”, without combining it with other lessons for the same activity.
📥 Export the results
After completing the analysis, click Export totals.
An Excel file containing the processed data will be downloaded. You can save it, sort it or use it for further analysis.
You can also click Another file to upload a new report and analyze a different period.
🔎 Important notes
- The analysis uses the attendance report downloaded from BookyWay.
- You can freely choose the period you want to analyze before downloading the report.
- Waiting-list entries are not included in the totals.
- Absences are calculated based on absences recorded by instructors/admins.
- Results can be viewed by client or by activity.
- The processed totals can be exported to an Excel file.
- Processing takes place directly in your browser: the data contained in the report is not sent to BookyWay and never leaves your computer. We only collect anonymous usage statistics for the tool, such as how often it is opened and which features are used, never the contents of your files.
💡 Tip
Don’t use Attendance Analysis only when you need to check a specific figure.
Reviewing it regularly — for example once a month — can help you spot early signs that some clients are attending less often and understand which activities are performing best.
This turns your report from a simple list of bookings into a useful tool for making better decisions about how to manage your center.